Overview
exNet (expression Network) is an interactive tool for exploring co-expression networks.
Basic Usage
exNet visualizes co-expression between genes in the active gene list. Co-expression is visualized by drawing a co-expression network where genes are displayed as nodes and co-expression between genes is indicated by connecting nodes with an edge (i.e. if two genes have a line connecting them, they are co-expressed above the selected threshold).
exNet display panel
The various elements of the exNet interface are shown Figure 1 and will be explained in detail. To view a network, exNet requires an active list of genes selected using the gene list tool. The network display shows an editable co-expression network of the current gene selection and allows various operations. Some of these operations are available by selecting genes and right clicking on the selection to access the selection menu. The actual network being displayed is controlled from the display settings panel. Various plots can be interactively displayed as the user selects network elements, and can be opened in their own specialised tools.
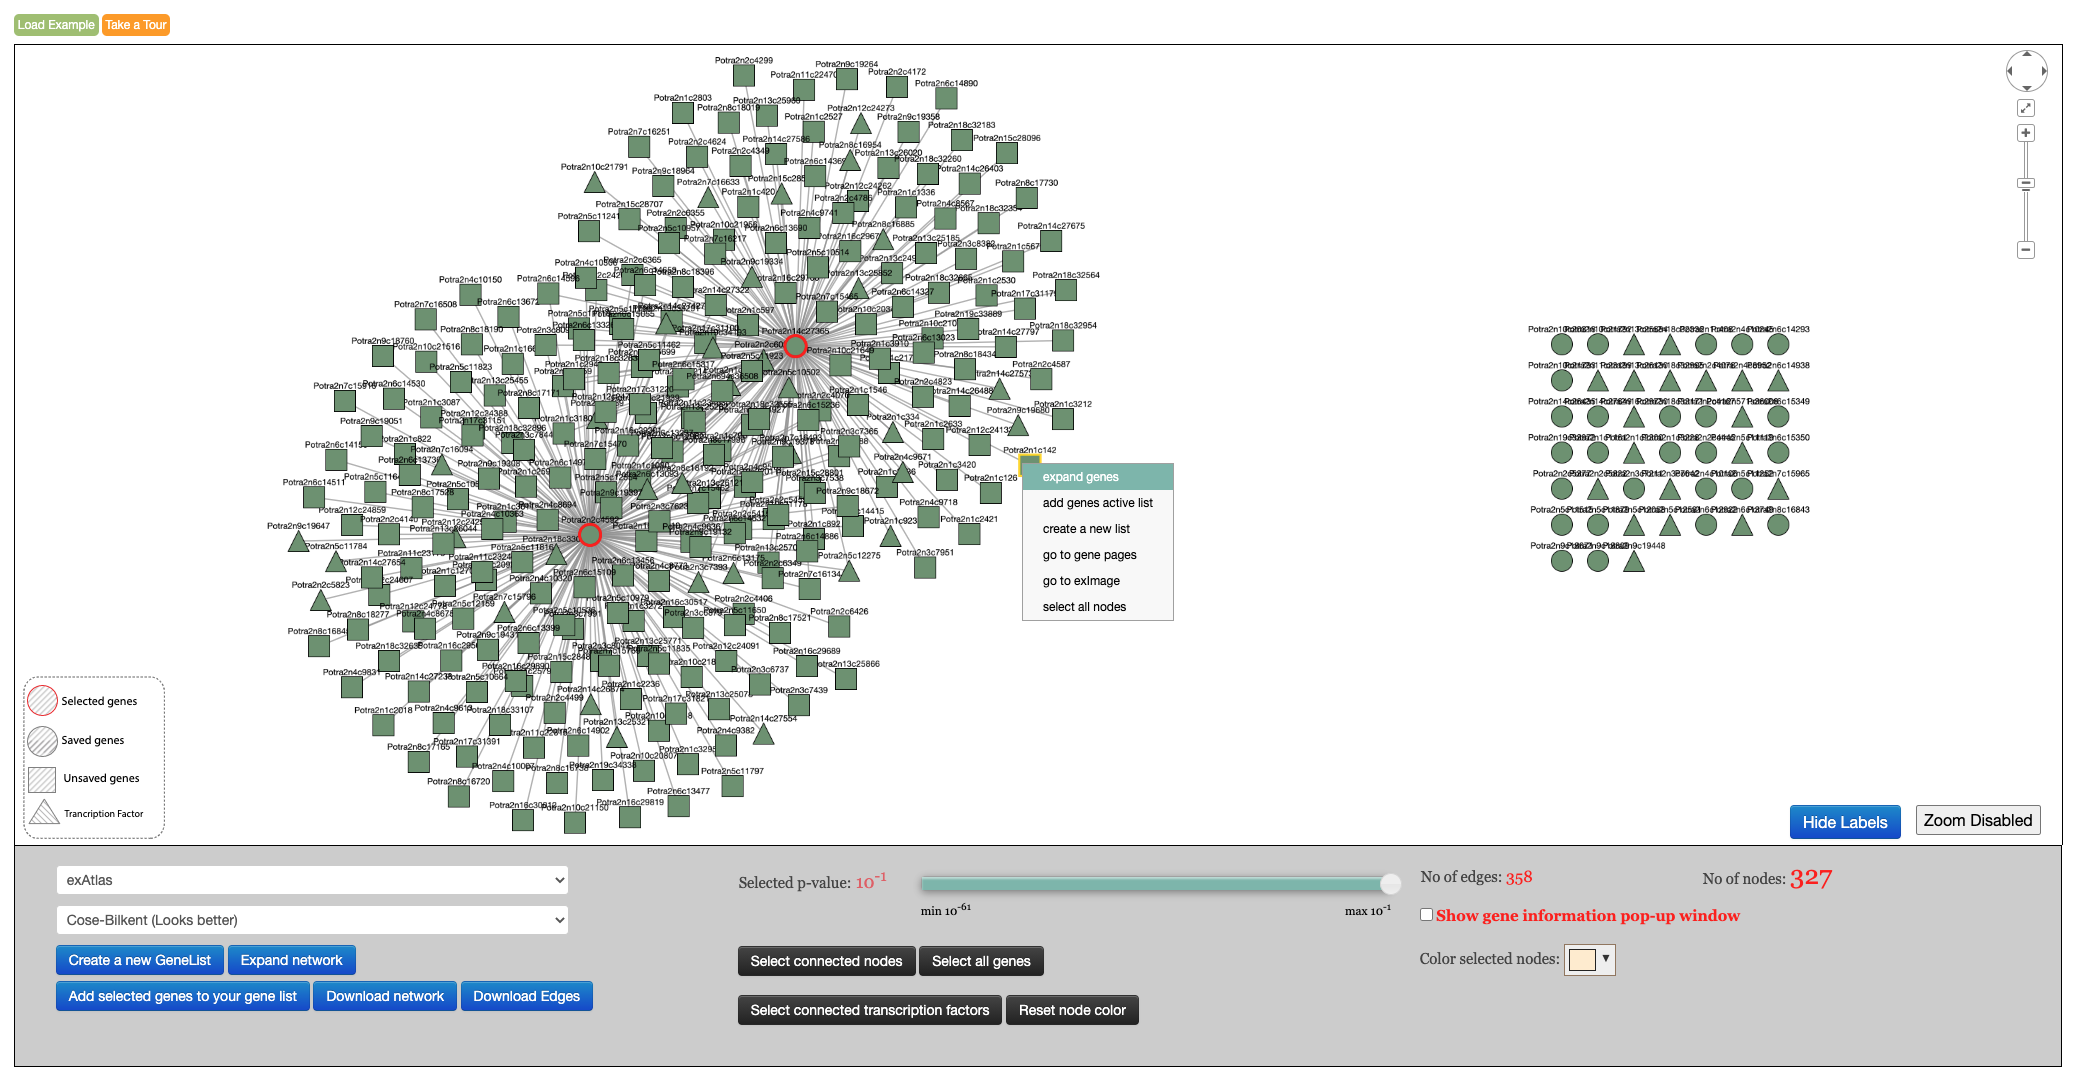
Figure 1. ExNet
Implementation
exNet uses Cytoscape Web (Flash) as the core for the network layout and visualization; the web page is coded in HTML, JavaScript and PHP. For structuring and printing the network information, a python script is used. The data is stored in a MySQL database and PHP mysql and Python MySQLdb packages are used to access the data.