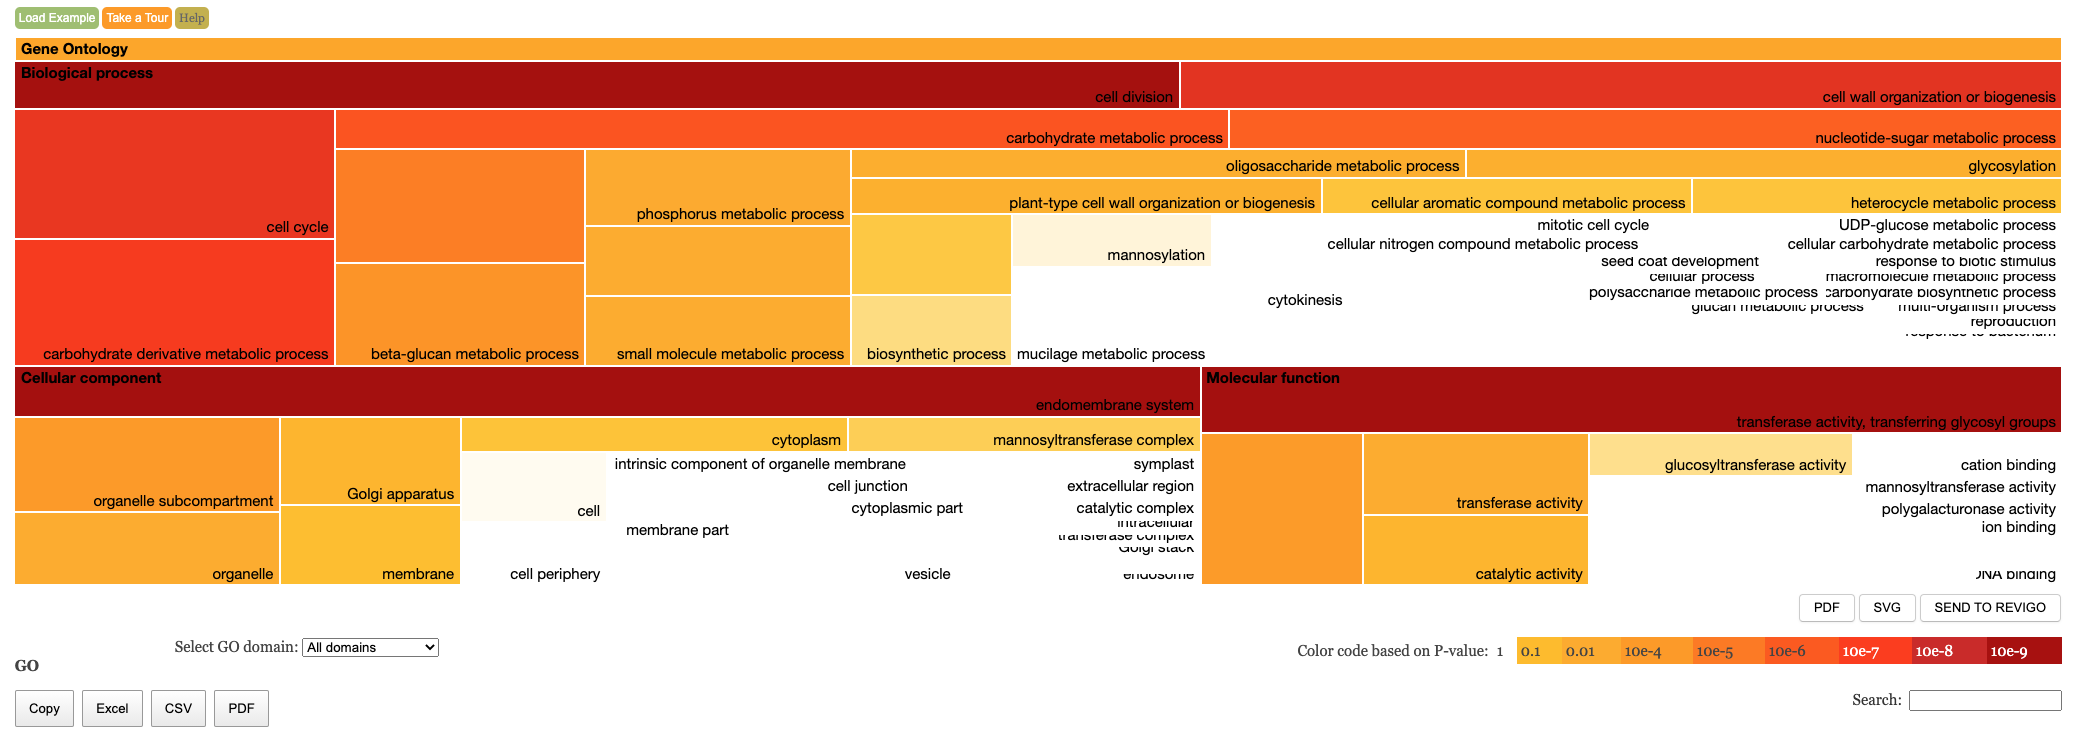
Enrichment Treemap
Results table
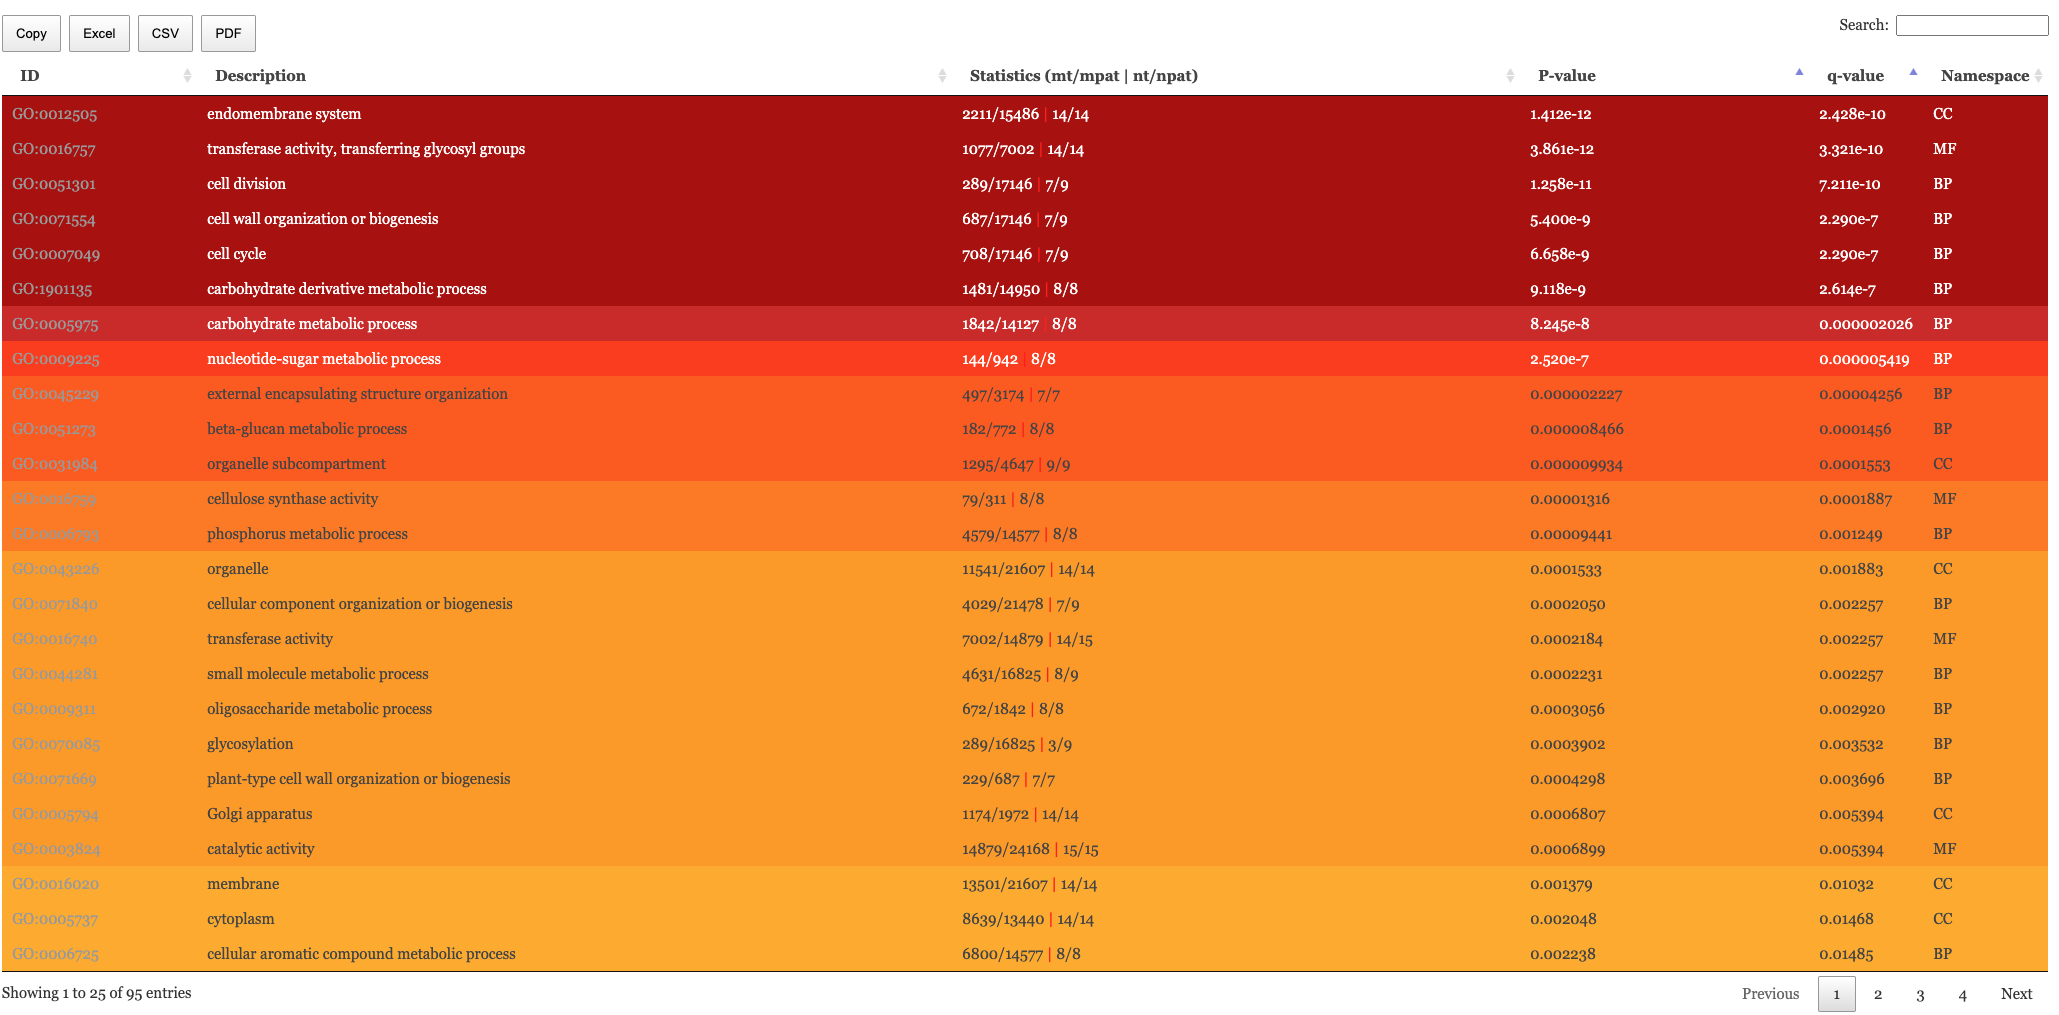 The table of results and tree map figure are colour coded to indicate statistical significance. Red means highly significant and white means less significant. We have the following columns in the Enrichment results.
- mt: The number of genes in the entire population annotated to this term
- nt: The number of genes in the test set annotated to this term
- mpat (Only “go” and “hierarchical”): The number of genes annotated to this term or parents of it in the entire population
- npat (Only “go” and “hierarchical”): The number of genes annotated to this term or parents of it in the test set
- pval: The naive p-value
- padj: The p-value adjusted for multiple testing correction (pval -> padj) is Benjamini-Hochberg.
*PlantGeniE uses GO test for GO enrichment and Fisher exact test for PFAM and KEGG.
Fisher’s Exact Test (By default) : https://github.com/brentp/fishers_exact_test
GO: https://academic.oup.com/bioinformatics/article/23/22/3024/208216
For more details https://github.com/bschiffthaler/gofer2